You are using an out of date browser. It may not display this or other websites correctly.
You should upgrade or use an alternative browser.
You should upgrade or use an alternative browser.
Monthly Retirement Slow-Trade system
- Thread starter dpong
- Start date
-
- Tags
- mrst trading system
Welcome to the Precious Metals Bug Forums
Welcome to the PMBug forums - a watering hole for folks interested in gold, silver, precious metals, sound money, investing, market and economic news, central bank monetary policies, politics and more.
Why not register an account and join the discussions? When you register an account and log in, you may enjoy additional benefits including no Google ads, market data/charts, access to trade/barter with the community and much more. Registering an account is free - you have nothing to lose!
- Messages
- 392
- Reaction score
- 877
- Points
- 268
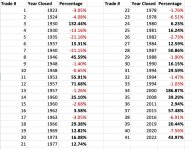
I used actual large cap funds that are available in my retirement accounts. I could not use the actual S&P 500. So the following results are theoretical and not claimed to be my actual. However I did do approximately as well. 
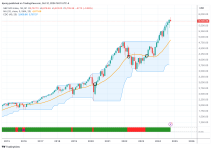
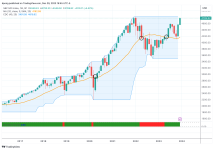
The system bought S&P 500 at 4183.03.
The S&P 500 closed the year at 4769.82 with me still 100% long.
That's a difference of +586.79 which comes out to +14.02%.
By my calculation the S&P 500 closed the year up 23.78%. So at first glance it appears that S&P 500 buy and hold would have greatly outperformed my Monthly Retirement Slow Trade System. But that is an illusion.
The S&P 500 started 2023 having dropped a long way below the 20 month moving average. So a non-trivial amount of that 23.78% was just to get the S&P back above the 20 month moving average.
My slow trade system never was long below the 20 month moving average. So I didn't take on all that downside. My cash was secure and earning some interest while sitting in cash during the contretemps. I had sold in April 2022, and was sitting flat until re-entering in June 2023.
It is from June 2023 that I made my 14.02%.
[This system is super slow and boring, and I love it very much.]

Viking
Yellow Jacket
Jordan Belfort, The Wolf of Wall Street, pretty much says an index fund is way to go, like the S&P 500 .I used actual large cap funds that are available in my retirement accounts. I could not use the actual S&P 500. So the following results are theoretical and not claimed to be my actual. However I did do approximately as well.
The system bought S&P 500 at 4183.03.
The S&P 500 closed the year at 4769.82 with me still 100% long.
That's a difference of +586.79 which comes out to +14.02%.
By my calculation the S&P 500 closed the year up 23.78%. So at first glance it appears that S&P 500 buy and hold would have greatly outperformed my Monthly Retirement Slow Trade System. But that is an illusion.
The S&P 500 started 2023 having dropped a long way below the 20 month moving average. So a non-trivial amount of that 23.78% was just to get the S&P back above the 20 month moving average.
My slow trade system never was long below the 20 month moving average. So I didn't take on all that downside. My cash was secure and earning some interest while sitting in cash during the contretemps. I had sold in April 2022, and was sitting flat until re-entering in June 2023.
It is from June 2023 that I made my 14.02%.
[This system is super slow and boring, and I love it very much.]
View attachment 11517
- Messages
- 18,793
- Reaction score
- 11,267
- Points
- 288
This is a revealing interview.Jordan Belfort, The Wolf of Wall Street, pretty much says an index fund is way to go, like the S&P 500 .
The question in my mind is "Will the US survive this period we're going through?"
What it comes down to is BRICS is the antitheses of NATO as an investment block.
NATO's MO is to conquer resources around the world by creating wars to overthrow governments. It's always been their MO.
BRICS's MO (afaict) is to develop resources FOR the people and their nation.
Therein lies WWIII in a nutshell. The survival of NATO vs the survival of BRICS.
You pays you money and you takes you chances....
- Messages
- 392
- Reaction score
- 877
- Points
- 268
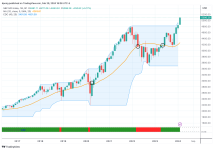
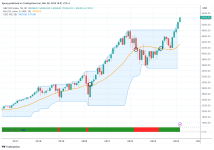
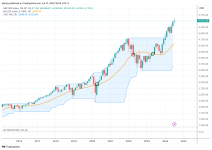
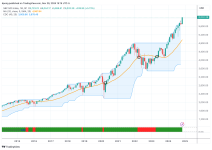
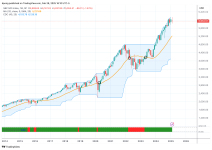
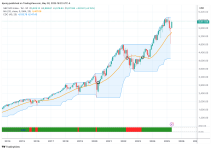
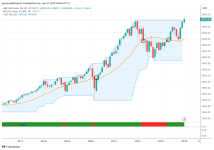
January 2024 closed with a gain of 1.49%. [S&P 500 achieved a new all-time high in January.]
That continued from a November 2023 gain of 8.92% and December 2023 gain of 4.42%.
You can easily tell visually that the 20 month moving average has curved upwards with a positive slope.
Since January closed above the 20 month moving average we will stay 100% invested in stocks. We will next check the price at the end of February 2024. That will be February 29th as this is a leap year!

- Messages
- 392
- Reaction score
- 877
- Points
- 268
Good question, and I had not thought much about that.Assuming that you might be in stocks long enough to generate a dividend and/or capital gain distribution, do you reinvest or send the divs/gains to cash?
In my retirement account I'm in fund JPMorgan US Equity R6. From my statement I can see that the dividends are reinvested into the fund. Again, I had previously not given it much thought.
However, as the situation is presumed positive so long as we are above the 20 month moving average, I would choose to reinvest in the stocks. So this is to my liking.
MrLucky
Homeless
- Messages
- 183
- Reaction score
- 227
- Points
- 178
I thought you might peel off the cash and hold it separately. Then when the curve moves down and you go to cash it would not suffer that 15% loss on the downslope. In the next upturn you'd invest it at the bottom 15% of the next upslope.
Reinvesting on the positive is buying more shares at a higher price. Your DCA is rising.
I'm sure you can tweak your investment to "not" reinvest dividends. They should be able to move this money to a money market account within your 401k.
Advantages both ways.
Reinvesting on the positive is buying more shares at a higher price. Your DCA is rising.
I'm sure you can tweak your investment to "not" reinvest dividends. They should be able to move this money to a money market account within your 401k.
Advantages both ways.
- Messages
- 392
- Reaction score
- 877
- Points
- 268
- Messages
- 392
- Reaction score
- 877
- Points
- 268
- Messages
- 392
- Reaction score
- 877
- Points
- 268
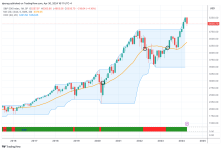
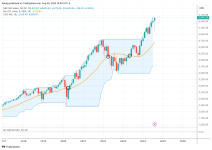
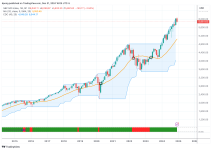
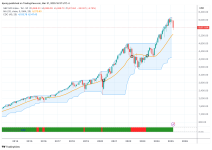
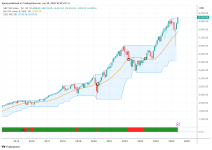
Friday was the last trading day of June. S&P 500 closed the month of June up 3.47%.
It closed above the 20 month moving average, so we are 100% invested in stocks. We will check the price and moving average again at the end of July.
[Last week at one point I calculated that our gains from the time we bought last June are 30.79%.]
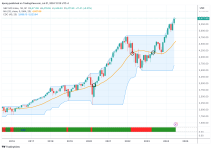
It closed above the 20 month moving average, so we are 100% invested in stocks. We will check the price and moving average again at the end of July.
[Last week at one point I calculated that our gains from the time we bought last June are 30.79%.]

- Messages
- 392
- Reaction score
- 877
- Points
- 268
- Messages
- 392
- Reaction score
- 877
- Points
- 268
- Messages
- 392
- Reaction score
- 877
- Points
- 268
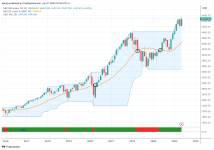
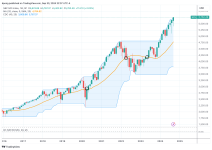
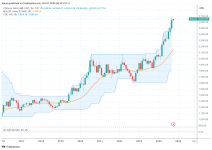
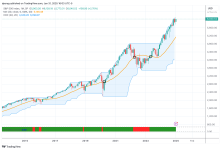
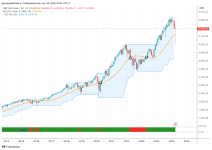
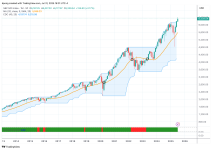
... so we remain 100% invested in stocks.
...
How fast do you react if the MA is crossed? I'm concerned about the stock markets. Insiders (incl. Buffet) are getting out like rats fleeing a sinking ship.
- Messages
- 392
- Reaction score
- 877
- Points
- 268
It is a slow trade system by design. The rule is we always check after the month closes. You're right, in a quick crash scenario we could lose some.How fast do you react if the MA is crossed? I'm concerned about the stock markets. Insiders (incl. Buffet) are getting out like rats fleeing a sinking ship.
- Messages
- 392
- Reaction score
- 877
- Points
- 268
- Messages
- 392
- Reaction score
- 877
- Points
- 268

