- Messages
- 15,689
- Reaction score
- 10,047
- Points
- 288
a stiffy? Morning wood?Schwing... what is this? Right up against the top of the Silver resistance. Now it might get interesting.
View attachment 7916
Welcome to the PMBug forums - a watering hole for folks interested in gold, silver, precious metals, sound money, investing, market and economic news, central bank monetary policies, politics and more.
Why not register an account and join the discussions? When you register an account and log in, you may enjoy additional benefits including no Google ads, market data/charts, access to trade/barter with the community and much more. Registering an account is free - you have nothing to lose!
a stiffy? Morning wood?Schwing... what is this? Right up against the top of the Silver resistance. Now it might get interesting.
View attachment 7916
See a doctor if it lasts more than 4 hours.
No rockets so that's a good sign...

Quick look for me found $2074.88 in August, 2020.Gold just about has to touch its nearly Triple All-Time Top. Anyone know what the all time spot high price is?
Hemke having difficulty containing his enthusiasm:Looking very "contained" coming up the the comex open.
Just sayin...

Part of the latest from Simon Black...
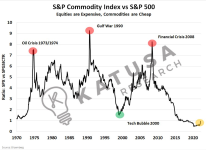
IF this is the beginning of a VIOLENT move upwards, commodities are about to get very expensive...
You’ll see that, relatively speaking, commodities are the cheapest they have ever been compared to the S&P 500. There’s nowhere to go but UP.
Gold Could Go Vertical, Fast
If you’ve been following precious metals for a long time, one thing’s for sure, the gold market has always moved in cycles. Going from dramatic boom to overnight bust, and eventually back again.
So far in this “boom,” gold has barely risen 20 percent from its floor. That’s not even close to the minimum required to qualify for a true “bull market” over the past century.
The smallest gold run-up in the past 90 years was 45 percent — more than twice the current gain. Every other rally was far, far bigger:
As you can see from the chart, when gold is ready to rise, it takes off.
- From 1972–1974, the rally yielded a 100 percent gain.
- From 1978–1980, another 100 percent gain.
- Then from 2007–2010, a 67 percent increase in the price of gold.
Every single one of the years in the date ranges above saw an increase of more than 20%. That’s how you know the gold rally has barely just begun.
View attachment 7967
...
In a report published Wednesday, the second biggest bank in America said that gold's fundamental prospects look strong as inflation remains persistently elevated and economic concerns continue to grow with weakness in the labor market, tightening liquidity and a "brittle" credit markets.
At the same time, gold's technical outlook paints bullish pictures. Bank of America technical strategist Paul Ciana, the lead author of the report, wrote that gold's and silver's break-out moves have emboldened the precious metals market. He added that gold's rally to its all-time high of $2,078 could signal the start of a two-year bull run, which could push prices above $2,500 an ounce.
However, he added that in the current environment, his initial target is above $2,100 an ounce.
...

A trio of bank collapses last month turned a regional-bank tracking exchange-traded fund into something of a market bellwether. And after a short stretch of price stability it’s “hanging by a thread,” a Wall Street technician warned on Wednesday.
The SPDR S&P Regional Banking ETF KRE, was down 2% near $41.65 shortly after midday, putting it on track for its lowest close since November 2020, according to FactSet data, trading below its March 23 close at $42.24 while holding above its March 24 intraday low at $41.28. KRE fell sharply on Tuesday ...
“Yesterday was a poorer session than the large cap indices implied, with the regional banks once again leading the market lower. KRE, the regional banking ETF, looks to me like it’s hanging on by a thread as it attempts to make a ‘triple bottom’ and hold above its recent lows,” wrote technical analyst Andrew Adams in a Wednesday note for Saut Strategy.
“I do not trust triple bottoms, as more often than not that third attempt lower ends up breaking down to new lows and ruining the potential pattern,” he said. “It looks like we’re likely to get a lower low in KRE and that has dragged the small-caps down with it.”
...
The gold spot chart for the last 24 hours looks completely natural. What could be more natural than horizontal and vertical lines?
Has anyone taken the time to look into the solidity of their online brokers?
I'm seriously considering moving an account to another broker given the banking concerns. Using Schwab, whose stock keeps sliding lower. Getting a bit nervous having all my stuff with these guys.
Any recommendations for a financially sound broker/bank that also has cheap trades, including options?
That was an amalgamation of your two prior posts - one noting Pamela Anderson's honest attributes and the other mentioning the crowd getting hosed down. I may have done the surgery but you furnished the scalpelPervy Doctor...
I feel like we broke out here on POG but we need some confirmation follow thru.
That‘s when I first observed Zed and one of his mates make multiple great calls/trades on a Aussie trading forum.
That silver daily chart really highlights the significance of this weeks price action. Silver looks to have sliced right thru that capping congestion fiasco we had to endure in December and January. Would be nice to see some follow thru next week.Silver Weekly & Daily - On a solid move, some significant lines in the sand to cross but so far momentum looks good.
View attachment 7990View attachment 7989
