You are using an out of date browser. It may not display this or other websites correctly.
You should upgrade or use an alternative browser.
You should upgrade or use an alternative browser.
The Lunatic Fringe - Market and Trade Chat
- Thread starter TheRealZed
- Start date
-
- Tags
- markets
Welcome to the Precious Metals Bug Forums
Welcome to the PMBug forums - a watering hole for folks interested in gold, silver, precious metals, sound money, investing, market and economic news, central bank monetary policies, politics and more.
Why not register an account and join the discussions? When you register an account and log in, you may enjoy additional benefits including no Google ads, market data/charts, access to trade/barter with the community and much more. Registering an account is free - you have nothing to lose!
- Status
- Not open for further replies.
TheRealZed
Retired Sailor
- Messages
- 3,002
- Reaction score
- 3,608
- Points
- 298
TheRealZed
Retired Sailor
- Messages
- 3,002
- Reaction score
- 3,608
- Points
- 298
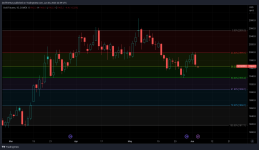
Gold, looking like it needs to get back above 2,000 if its going to be bullish.
View attachment 8838
We need a higher high on the next swing up and we can't afford any lower than a double bottom @ that 50% area... IMO. SO yeah 2K plus soonish is needed.
Cigarlover
Yellow Jacket
- Messages
- 1,399
- Reaction score
- 1,611
- Points
- 283
We'll get there. I still think 1800 comes 1st though.We need a higher high on the next swing up and we can't afford any lower than a double bottom @ that 50% area... IMO. SO yeah 2K plus soonish is needed.
TheRealZed
Retired Sailor
- Messages
- 3,002
- Reaction score
- 3,608
- Points
- 298
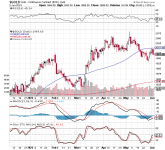
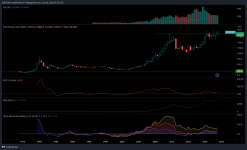
GC - Gold - 6mth chart. Taking a look at a wide time frame the back drop looks gold positive from a T/A perspective. We went about 3x from these sorts of indicator levels as the 1900+ spike occurred in 2011. IMO this is ~ = to the mid $600 in 06/07. $1800 x 3 gives $5400 which is a number I estimated back in 2002 looking at the 70's bull market relationships and applying them to the ~ Y2K lows. It also cropped up in some fibo work projecting off the 2011 run up. I know we get some wild numbers thrown at us but I think this next run stops there about. After that?!

- Messages
- 383
- Reaction score
- 852
- Points
- 268
Damn fine chart!GC - Gold - 6mth chart. Taking a look at a wide time frame the back drop looks gold positive from a T/A perspective. We went about 3x from these sorts of indicator levels as the 1900+ spike occurred in 2011. IMO this is ~ = to the mid $600 in 06/07. $1800 x 3 gives $5400 which is a number I estimated back in 2002 looking at the 70's bull market relationships and applying them to the ~ Y2K lows. It also cropped up in some fibo work projecting off the 2011 run up. I know we get some wild numbers thrown at us but I think this next run stops there about. After that?!
View attachment 8843
Lancers32
Often Wrong Never In Doubt
- Messages
- 1,835
- Reaction score
- 2,102
- Points
- 298
Gold has gone up by a factor of 8 times off of every Major bottom. 100 800 plus 250 1920ish. 8000 is more than reasonable.GC - Gold - 6mth chart. Taking a look at a wide time frame the back drop looks gold positive from a T/A perspective. We went about 3x from these sorts of indicator levels as the 1900+ spike occurred in 2011. IMO this is ~ = to the mid $600 in 06/07. $1800 x 3 gives $5400 which is a number I estimated back in 2002 looking at the 70's bull market relationships and applying them to the ~ Y2K lows. It also cropped up in some fibo work projecting off the 2011 run up. I know we get some wild numbers thrown at us but I think this next run stops there about. After that?!
View attachment 8843
GC - Gold - 6mth chart. Taking a look at a wide time frame the back drop looks gold positive from a T/A perspective. We went about 3x from these sorts of indicator levels as the 1900+ spike occurred in 2011. IMO this is ~ = to the mid $600 in 06/07. $1800 x 3 gives $5400 which is a number I estimated back in 2002 looking at the 70's bull market relationships and applying them to the ~ Y2K lows. It also cropped up in some fibo work projecting off the 2011 run up. I know we get some wild numbers thrown at us but I think this next run stops there about. After that?!
View attachment 8843
That looks like an Excellent Rocket Ship Platform to me. Nice strong Cup and Handle and we've managed to take a lot of momentum out while maintained near all-time highs. Someone just needs to give us the Countdown.
Also, I think price targets are going to get pretty silly, don't get shaken out because of some target. Remember that values gold in USD and the USD is dying. I have set my price goals in terms of houses/cars etc. What do I think a house will sell for in gold ounces, etc.
Last edited:
That looks like an Excellent Rocket Ship Platform to me. Nice strong Cup and Handle and we've managed to take a lot of momentum out while maintained near all-time highs. Someone just needs to give us the Countdown.
Also, I think price targets are going to get pretty silly, don't get shaken out because of some target. Remember that values gold in USD and the USD is dying. I have set my price goals in terms of houses/cars etc. What do I think a house will sell for in gold ounces, etc.
How did I miss this chance?
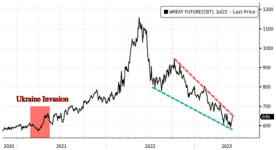
I actually wanted to add some softs after they were beaten down pretty bad and it is starting to dry out in the Midwest. I bought like 3 WEAT $7 call options yesterday. It has really been beaten down, for no real good reasons that I can see. Ya, Ukraine isn't a disaster but still, we are below invasion levels.
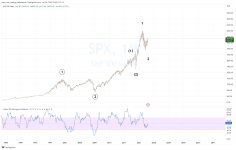
Personally I don't like all those small Fib retracements and such. I don't like to trade real often as I just get faked out. I like looking a little longer term picture and try to get the bigger moves right.
View attachment 8810
Looks like we are not the only ones noticing wheat. Plus this flood in Ukraine is adding to possible bullishness. That looks like one big falling wedge and is bullish if we can break out. Possible price target back to at least $8 / bushel.
ZeroHedge
ZeroHedge - On a long enough timeline, the survival rate for everyone drops to zero
- Messages
- 15,685
- Reaction score
- 10,045
- Points
- 288
My understanding is this 'flood' is only temporary....Looks like we are not the only ones noticing wheat. Plus this flood in Ukraine is adding to possible bullishness. That looks like one big falling wedge and is bullish if we can break out. Possible price target back to at least $8 / bushel.
ZeroHedge
ZeroHedge - On a long enough timeline, the survival rate for everyone drops to zerowww.zerohedge.com
My understanding is this 'flood' is only temporary....
Sure, but here is the worry. Plus it may damage some current crops, I don't know.
" The risk is Russia could reduce the flow of grain exports from Ukraine through the Black Sea in response to the incident. "
Lancers32
Often Wrong Never In Doubt
- Messages
- 1,835
- Reaction score
- 2,102
- Points
- 298
Sure, but here is the worry. Plus it may damage some current crops, I don't know.
" The risk is Russia could reduce the flow of grain exports from Ukraine through the Black Sea in response to the incident. "
I think the risk is not having at least a small position in the commodity complex.
I think the risk is not having at least a small position in the commodity complex.
Commodities are THE place to be for the next 20 years. I have a good portion of my money in the space. You just want to diversify a bit in the space so you are not All silver or All Oil etc. The grains are another good area. DBA which has a variety of food gives some exposure to meat and coffee, etc.
TheRealZed
Retired Sailor
- Messages
- 3,002
- Reaction score
- 3,608
- Points
- 298
Remember that values gold in USD and the USD is dying.
Hmmmmm, down here we value it in AUD.
I have not been able to poke a decent hole in the idea that the USD dies in strength before exceptional weakness, so there is that. I'm fairly convinced we have not seen the full extent of the up leg yet. For me the AUD Gold price high is likely to come well before the USD high, when the USD fails the AUD is likely to preform quite well so gold may not be worth holding @ that point.
... and we are looking @ this deflationary condition developing.
... while I think that their is a strong bull case for oil I can see that it might end up coming from a much lower after some dis-order in the market. Ditto commodities, I'm not convinced that the road will be smooth going forward although I think an epic opportunity is coming @ some point.
Long story short I think that these markets will become a bit treacherous, blowing yourself up while being at some level fundamentally correct will be easy. As goldbugs we should be right at home with that concept!
So yeah... hmmmm, I'm not thinking this will be that straight forward at all.
PS> The spread sheet that I made (Fibo based), the one that projects 4300 (min) to $5400 gold (probable), is the one that projected a $48 high in silver a long time before that reality (it sounded nutz @ the time). So far it's been close to the money in most respects. BTW it said $158 (min) to $199 silver (probable). This time around. I have no idea if that is a final target for this bull market, I suspect not... but?!
Lancers32
Often Wrong Never In Doubt
- Messages
- 1,835
- Reaction score
- 2,102
- Points
- 298
Yep could go lower before the launch but tough to pick absolute bottoms. Like the March 2020 bottoms in the pm complex. Hecla I think it was bottomed at $1.50 closed that day of the very bottom at 2 bucks. Tough to blow your fingers off if you don't play with leverage or time.
Hmmmmm, down here we value it in AUD.
I have not been able to poke a decent hole in the idea that the USD dies in strength before exceptional weakness, so there is that. I'm fairly convinced we have not seen the full extent of the up leg yet. For me the AUD Gold price high is likely to come well before the USD high, when the USD fails the AUD is likely to preform quite well so gold may not be worth holding @ that point.
... and we are looking @ this deflationary condition developing.
... while I think that their is a strong bull case for oil I can see that it might end up coming from a much lower after some dis-order in the market. Ditto commodities, I'm not convinced that the road will be smooth going forward although I think an epic opportunity is coming @ some point.
Long story short I think that these markets will become a bit treacherous, blowing yourself up while being at some level fundamentally correct will be easy. As goldbugs we should be right at home with that concept!
So yeah... hmmmm, I'm not thinking this will be that straight forward at all.
PS> The spread sheet that I made (Fibo based), the one that projects 4300 (min) to $5400 gold (probable), is the one that projected a $48 high in silver a long time before that reality (it sounded nutz @ the time). So far it's been close to the money in most respects. BTW it said $158 (min) to $199 silver (probable). This time around. I have no idea if that is a final target for this bull market, I suspect not... but?!
I like Jeff and the EuroDollar University and all as he understands the current debt markets better than almost anyone.
However, I think he's too based in academia and is missing some vital info. They really seem to confuse inflation and think its Only due to one cause.
Also, one our Wheat / grain trade this is another comment from ZH article today.
". In addition to the flooding, this will restrict the water supply and Ukraine’s agricultural output, pushing up global prices of grains and other produce."
Plus another article showing that the US lowered corn status and show that the drought is starting to set in already. June SHOULD be our wettest month. It's been very low humidity, more like a desert.
Lancers32
Often Wrong Never In Doubt
- Messages
- 1,835
- Reaction score
- 2,102
- Points
- 298
War has always been bullish for commodities. Combined with governments trying to take over farmland I fail to see a bearish case long term.

 www.armstrongeconomics.com

Gold & the Future | Armstrong Economics
QUESTION: Mr. Armstrong, first I want to thank you for your independent analysis. In gold, all they ever say is buy - buy - buy. It seems if you ever say anything else, they ridicule you. Gold to them is a religion, not an investment. My question is that you have always said that the
Congrats on riding one of the smaller waves. I think the shorts are really gonna start feeling some heat.
- Messages
- 383
- Reaction score
- 852
- Points
- 268
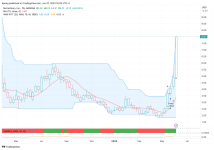
When times are good and we are in condition green, the WTT uses 40% trailing stop losses.
See here we are positioned to allow some volatility and still continue to let it grow higher.
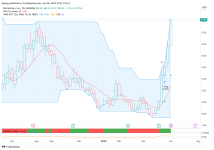
In the below chart, the stop loss is currently down at $4.83. See the plus sign (+).
[The chart is MicroVision for you phone guys.]
See here we are positioned to allow some volatility and still continue to let it grow higher.
In the below chart, the stop loss is currently down at $4.83. See the plus sign (+).
[The chart is MicroVision for you phone guys.]

Speaking of which Gamestop is running today with Earnings tonight and then the $EC goes and does this...This is Big news and likely led to CS downfall.
- Messages
- 383
- Reaction score
- 852
- Points
- 268
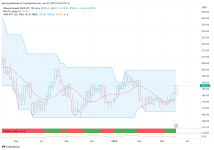
Condition green is when the IWM Russell 2000 Index ETF weekly chart closes above its 10 week moving average. Then we use 40% trailing stops.
Condition red is when the Index's weekly chart closes below its 10 week moving average. Then we use 10% trailing stops.
[In this way, the Weekend Trend Trader swings for the fences, because its success lies with extreme winning outliers.]
Condition red is when the Index's weekly chart closes below its 10 week moving average. Then we use 10% trailing stops.
[In this way, the Weekend Trend Trader swings for the fences, because its success lies with extreme winning outliers.]

Haha I have to laugh. I have been putting a little bit of $ in TNA recently sitting on some gains, that’s a warning I usually lose any gains I sit on. Maybe it’s different this time.When times are good and we are in condition green, the WTT uses 40% trailing stop losses.
See here we are positioned to allow some volatility and still continue to let it grow higher.
In the below chart, the stop loss is currently down at $4.83. See the plus sign (+).
[The chart is MicroVision for you phone guys.]
View attachment 8865
- Messages
- 383
- Reaction score
- 852
- Points
- 268
Ha. I just went and looked up what TNA is. I'm not sure my comments are appropriate for that vehicle.Haha I have to laugh. I have been putting a little bit of $ in TNA recently sitting on some gains, that’s a warning I usually lose any gains I sit on. Maybe it’s different this time.
For a Small Cap Bull 3X Shares, I'm not sure what to do with that. G'Luck there!
TheRealZed
Retired Sailor
- Messages
- 3,002
- Reaction score
- 3,608
- Points
- 298
I think the biggest mistake traders make is to take profits too early. But, yeah, sometimes that means you give some back.
[Second biggest mistake is to sell losers too slowly. LOL.]
Trailing stops tailored to the instrument are good IMO. EMA's, ATR etc...
JMO
TheRealZed
Retired Sailor
- Messages
- 3,002
- Reaction score
- 3,608
- Points
- 298
TheRealZed
Retired Sailor
- Messages
- 3,002
- Reaction score
- 3,608
- Points
- 298
TheRealZed
Retired Sailor
- Messages
- 3,002
- Reaction score
- 3,608
- Points
- 298
TheRealZed
Retired Sailor
- Messages
- 3,002
- Reaction score
- 3,608
- Points
- 298
TheRealZed
Retired Sailor
- Messages
- 3,002
- Reaction score
- 3,608
- Points
- 298
Haha I have to laugh. I have been putting a little bit of $ in TNA recently sitting on some gains, that’s a warning I usually lose any gains I sit on. Maybe it’s different this time.
Well that's a load of bull...
- Status
- Not open for further replies.


