The Lunatic Fringe - Market and Trade Chat

Welcome to the Precious Metals Bug Forums

Welcome to the PMBug forums - a watering hole for folks interested in gold, silver, precious metals, sound money, investing, market and economic news, central bank monetary policies, politics and more. You can visit the forum page to see the list of forum nodes (categories/rooms) for topics.

Why not register an account and join the discussions? When you register an account and log in, you may enjoy additional benefits including no Google ads, market data/charts, access to trade/barter with the community and much more. Registering an account is free - you have nothing to lose!
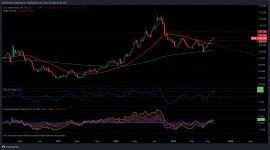
DXY Weekly - I've looked back through this chart and the weekly ROC is at levels we should see some softness for a while, HOWEVER the other indicators are more in a place that suggest the action going forward will be more choppy sideways than a strong new down trend. Down to test the 101.5 to 102 area is my guess for the next leg. We probably will spike down to 100 intra week but I'd expect buying down there, at least at first.

DXY_2023-09-20_08-02-53.png
 
US10Y Daily - Looking like a double top. No volume available, but still, good candidate IMO. Watch the line. The Fed could set the market and gold alight soon.

US10Y_2023-09-20_09-30-18.png
 
I think that 24 sees a market high, including gold, that will be very tradable. Seems quite plausible to me.
Who knows. Reading more along the lines of a major buy in the metals in 2024 so a low.
 
Fed will likely announce that they are holding rates steady this afternoon. Future guidance likely to be more hawkish than the market wants. It looks like markets are starting to realize the Fed isn't planning to deal the rate cut crack like they want.

ram%20dot%20plot.jpg


...
"What I would suggest all of your viewers do is very simple — just watch the 2-year and the 10-year. Right now, the 2-year yield is trading above the 10-year. Watch for that to slowly go down," he said. "When it gets down to that 10-year level and then drops below it, that's when you really have to be risk-off, and that's when you really have to be paying attention."
...
...

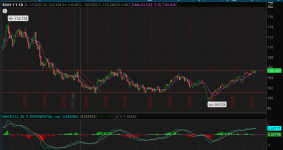
U.S. Treasury yields dipped slightly on Wednesday, pulling the 10-year yield back from highs not seen in more than 15 years as investors awaited the latest update out of the Federal Reserve.

The yield on the 10-year Treasury was down by around 2 basis points to 4.343%, a day after after trading at levels last seen in November 2007. The 2-year Treasury was last lower by nearly 4 basis points at 5.071% ...

https://www.msn.com/en-us/money/mar...ead-of-fed-interest-rate-decision/ar-AA1gZ4pA

:popcorn:
 
Screen Shot 2023-09-20 at 5.45.11 PM.pngDollar tryin to break to door down and go higher. If it breaks through it could go screaming higher. Should give Jerome what he wants if that happens. Lower stock market and metals prices.See what the rest of the week brings. I was underwater on some SLV calls. They spiked up and also hit resistance line so I dumped them. Only a 10% profit but I'll take that over a loss anyday.
 
US10Y

Daily - So the double top idea is being tested, kinda needs to fail NOW if that is the case. Stretching the bounds and looking very much like a breakout. We are now into pre 2008 rate levels for the first time since that Oct.

US10Y_2023-09-21_07-54-38.png

Monthly - You have to say this chart looks strong, scary strong really.

US10Y_2023-09-21_07-54-48.png
 
NDX

Daily - Looks like a breakdown.

NDX_2023-09-21_08-05-51.png

Weekly - Below ~14609 area and it looks like we might head to the mid 13K area.

NDX_2023-09-21_08-21-04.png
 

Asia open: The FOMC minutes were a touch more hawkish

The drive higher in rates will always inject some turbulence into the US equity market.

Stocks down with US yields and the dollar both up mean only one thing: the market universally reads the FOMC statement through a more hawkish lens. Indeed, 12 members saw a reason for another rate hike this year, while 7 did not. Additionally, only 2 rate cuts are embedded in member projections for 2024, down from 4 in the last meeting. The long-term median dot, a proxy for the Fed's view of where the "neutral" rate falls, remained at 2.5%.

The critical question is where interest rates will ultimately settle once the Fed concludes its hiking cycle. And whether the US economy avoids a recession is a significant consideration for both stock and bond investors. However, based on their projections of sharply higher GDP growth, a lower unemployment rate, and lower core inflation, The Federal Reserve ( Fed) is more self-assured that it can achieve a soft landing and that the economy can sustain higher rates for a longer period. Even if the Fed doesn't hike, they will likely be in no rush to cut rates.
 
It's been access market selling, low volume, cheap downside, I guess we have to wait and see...

1695256906144.png
 
DXY done did it. Broke above that resistance.

Bond yields are higher than they have been in a long time. Over 5% so for every million you throw into bonds your getting a guaranteed return of 50k+ annually. Based on that, big money can move out of the overbought and over valued stock market and get a nice return for parking cash in bonds.
Add in QT by the fed plus the black out period for corps to buy back shares right now and it sure feels like a perfect storm for a lower stock market. A badly needed correction IMO.
 
For some real longer term perspective. Here's a 20 year chart of the nasdaq. 2016 it was at about 4200. The 2020 lows were around 6600 or so. That was 3 years ago. I can't say when but seems to me the charts are saying we should be closer to 7500. Screen Shot 2023-09-20 at 9.25.28 PM.png
 
For a little comparison. 1999 the nasdaq hit like 11k or something like that. 2 years later it was under 800. Lost 90% of it's value in 2 years. Based solely on that a drop to 7500 doesn't seem so unreasonable.

I typically lose my ass in options but I sure would like to buy some puts here. Just not sure on the timeframe.
 
For some real longer term perspective. Here's a 20 year chart of the nasdaq. 2016 it was at about 4200. The 2020 lows were around 6600 or so. That was 3 years ago. I can't say when but seems to me the charts are saying we should be closer to 7500. View attachment 10477
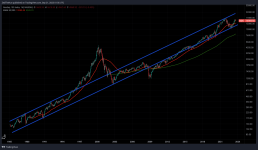
My thought is that long term you have to look at markets on a log chart because markets tend to be exponential. This is a long term NASDAQ log scale. You can see the tech bubble and the 08 bust in this context for what they were. Right now it argues that 12.5K to 21K is within "range" or a normal outcome given the time involved . Buy 12.5, Sell 21, right now it is anyone's guess, could go either way, but we are not at obvious extremes.

NDX_2023-09-21_11-56-57.png
 
I'm not quite there, yet. Still looks +ve for now.

View attachment 10478
Yea my line was drawn a little low. I don't see anything stopping the push higher though. Metals, oil, euro, natural gas, copper, all acting like a higher dollar is a thing.

I am scratching my head over the central banks loading up on gold and yet the dollar is also going higher. You would think they expected the dollar to go lower.
 
My thought is that long term you have to look at markets on a log chart because markets tend to be exponential. This is a long term NASDAQ log scale. You can see the tech bubble and the 08 bust in this context for what they were. Right now it argues that 12.5K to 21K is within "range" or a normal outcome given the time involved . Buy 12.5, Sell 21, right now it is anyone's guess, could go either way, but we are not at obvious extremes.

View attachment 10479
You are correct when you put the chart in that perspective. I'm not trying to be argumentative here, just having a discussion.
Look like your 200 day MA is around 8k which is pretty close to my 7500 call.
So stepping back a bit and looking at your chart it would appear that everything is within range and pretty much middle of the road within that channel right now. Could go higher or lower and still be within the channel. Is that realistic though? In comparison, looking my chart it shows how fast we have gone up. Up over 100% in 2 years? Also looks close to a double top and is about to roll over.

Let's also consider that the magnificent 7 are really what driving the index. Unfortunately those earnings and PE's are not sustainable. NVDA over 100 PE. Every chip manufacturer on the planet is looking at them right now and wanting a piece of that Ai action. I dont know the industry well but I imagine within 12-18 months the competition is going to be knocking on NVDA's door. That 100 PE will at least get knocked in 1/2. TSLA with a PE over 75. Every other announcement out of Elon is another cut in car prices to be competitive. A normal PE for car manufacturers is about 12. META pe 35. An 800 billion dollar company and I have no idea how they make 1 penny. Yea ads but 800 billion worth? Are they getting super bowl money for their ads every minute of every day? By comparison Fox News has a market cap of 14 billion and a PE of 12.
Obviously my point is that these corps are way over valued. Stock buy backs juice their earnings per share but they can only buy back stock for so long. Eventually they become private. LOL.

I have no idea what's really driving higher prices and keeping all of this afloat. Lower unemployment and everyone dumping money into 401k's which in turn have to go after higher rates of return so dump money into the 7 top tech stocks? I dunno. Doesn't seem sustainable to me though. Nor does the 33 trillion in debt. Just to service that debt will start costing tax payers 800 billion to a trillion a year. How much longer can this go on?

Eventually I think we do head south and get closer to that 7500-8k level.
 
Look like your 200 day MA is around 8k which is pretty close to my 7500 call.

Those are 50 & 200 Month averages, the way they are coded they change with the charts period.

Could go higher or lower and still be within the channel.

Yeah, it is quite a range!

Is that realistic though?

It should be, growth + inflation tends to exponentially grow the numbers. We could never see 3K DOW again without total economic destruction. 10K would be a mighty crash.

Every chip manufacturer on the planet is looking at them right now and wanting a piece of that Ai action.

Sure, but so long as they are listed on the NASDAQ we get a rebalance Nvidia may lose but others will gain. Remember that indexes survivor bias, so all that matters is that the AI market over all doesn't implode. A bubble may come, but it should be broad. The 90's bubble saw everything with .com run, now we are polar opposite to that with a worryingly narrow market. I'm told kids buy FaceBook and that's it, they stop right there! Certainly seems to be true.

IMO Tech (growth) companies are better looked at though a PEG ratio, granted they are look expensive but not as expensive. Sub 1 is cheap, TSLA is ~4, expensive, but they expect massive growth. This will change as the industries mature, but for now the market still loves growth stories.

I'm not saying that I think current prices are correct, just trying to frame how the market is looking at it. You may well be spot on in individual cases but then we have to consider competitor growth when dealing with the index.

I have no idea what's really driving higher prices and keeping all of this afloat.

It's just liquidity that HAS to be placed somewhere. That is going to drive us higher until we have another systemic credit crunch ---> JMO

As Yellen said...

"I do not believe that there will be another financial crisis for at least as long as I live"
... that is simply because they will not let the banking system collapse and stand ready to lubricate it as much as is required.
What that will do to asset prices should be nutz, but it seems that they have determined that this is the only palatable way out of any bad situation.
I dunno man, but I am sick of being on the wrong side of this thing and I suspect it has a long way to go before we get a 29 style bust... if ever. IMO I think that all the numbers just get bigger and the best thing to do is go for the ride. The only question is when to step aside for periods. On that measure, this recent action has been a hated bull market, which among other things leads me to the idea that the melt up idea might just be exactly what we get. I suspect gold moves up with the final phase, then they all correct together.

... but really, what do I know?!

Eventually I think we do head south and get closer to that 7500-8k level.

Late 24?

I dunno. Doesn't seem sustainable to me though. Nor does the 33 trillion in debt. Just to service that debt will start costing tax payers 800 billion to a trillion a year. How much longer can this go on?

Long enough to break the likes of us... Yeah, 100% this looks doomed to failure, in the end. However, they will end run it in whatever way they can, we just have to make sure we are in a safe place when they do. One thing we might have to accept is that gold may not be that safe a place when they start making wholesale reforms to save the system. I assume it will involve CBDC's and locking everyone into that system. At that point, gold may just be outlaw stuff for central banks only... again... who knows?!
 
Back
Top Bottom