The Lunatic Fringe - Market and Trade Chat

Welcome to the Precious Metals Bug Forums

Welcome to the PMBug forums - a watering hole for folks interested in gold, silver, precious metals, sound money, investing, market and economic news, central bank monetary policies, politics and more. You can visit the forum page to see the list of forum nodes (categories/rooms) for topics.

Why not register an account and join the discussions? When you register an account and log in, you may enjoy additional benefits including no Google ads, market data/charts, access to trade/barter with the community and much more. Registering an account is free - you have nothing to lose!

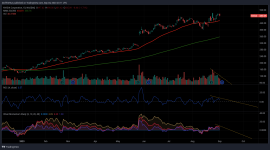
Gold Daily - Nearest support looks like the 50/200DMA as before @ ~1950ish.
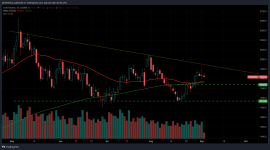
GC1!_2023-09-05_08-58-34.png

Backing up a little, to me, it looks like a big continuation pattern that has yet to breakout. Support is clear, volume is declining as we go, less willing sellers at these levels (for now)
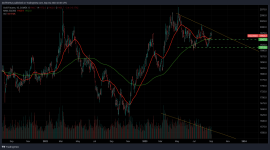
GC1!_2023-09-05_09-03-48.png

Not that clean a chart, but using classic metrics it would have me targeting 2500 on the next major move... SHOULD this resolve upward.
 
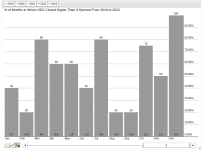
Five years of GDX seasonality says that you want to be more on the buy side between here and early October.

1693869898679.png
 
I've been sitting on this pile of metal for (what seems like) forever.
When am I gonna be rich?
I'm getting old...
Something's gotta happen soon

I hear that. Getting very bored with it all. Looking forward to a more positive phase.
 
I've been sitting on this pile of metal for (what seems like) forever.
When am I gonna be rich?
I'm getting old...
Something's gotta happen soon
It's insurance.

Look out the window. Inflation is insane. What do you suppose will happen in a year of this?

Folks are just getting by. Look at how much debt is on credit cards. That's how they are surviving!

Too much month left at the end of the money.

Imagine taking a silver eagle you bought for $6 and cashing it in because you need dollars vs using your credit card.

You're still safe. Everyone else is at risk!
 
ASX Gold tribe soft today ~4% looks like opportunistic shorting off the 50 DMA's that many are around. Could be a short trade for them IMO.
 
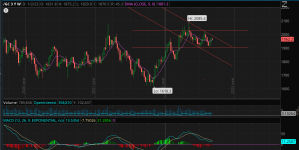
Screen Shot 2023-09-04 at 11.20.49 PM.pngLooks to me like gold is in a slightly downtrending channel but at the same time you could argue sideways consolidation or even a cup and handle forming.I like the cup and handle but that handle could stretch out for another 6-12 months and still be valid.
 
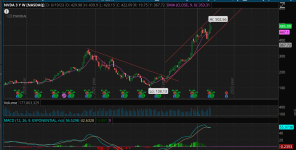
NVDA weekly chart. Looks like 2 topping candles although last weeks could be considered a dojo also I suppose. Screen Shot 2023-09-04 at 11.24.58 PM.png
 
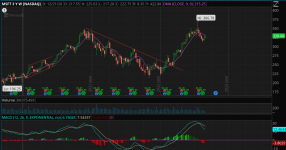
MSFT got that big topping tail mid July. Then turned down. Now back up to that DMA (I have it set at 9). Should turn back down from here IMO. Screen Shot 2023-09-04 at 11.26.46 PM.png
 
To me the indexes look very similar except that most of them have just moved above that DMA line. Of course there is a chance that everything could turn around and just power higher. Something I would expect at the start of a bull market or in a very strong economy.
All of the Data seems negative. Higher unemployment rate (Lies from BLM for just about every reporting date and then the following month all revisions are downward, never upward). Credit at all time highs, mortgages dropping off a cliff(One of the key factors that actually drive an economy is the housing market).

Just my opinion but I am looking to get short. Short term anyway, just try and grab some small gains and stay as liquid as possible while this mess sorts itself out.
 
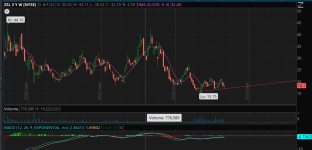
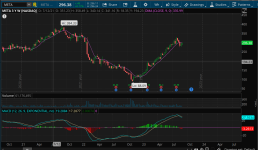
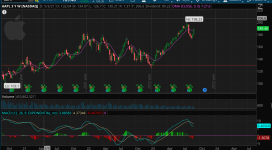
All of these charts are weeklies.
So here's ZSL. Slightly up trending and last week it pulled all the way back to the uptrend line and bounced putting in a bottoming tail. I did take a position in this last week and it is the only new position I have added. It's really just insurance against a falling silver price to protect what little I have in my silver miners.
If this runs back up to 21.30 or so it will be it's 3rd attempt at that level. A break above that and it may head up to the 24.80 level to fill the gap up there. Of course that would send silver down to about 20 and I don't really expect that unless there is a severe downturn in the markets that drag the metals down temporarily as well.
Screen Shot 2023-09-04 at 11.41.40 PM.png
 
Meta. Since Dec of last year been riding above that DMA line. Then it broke below 3 weeks ago. Now back up to it and from there should go down. TSLA looks similar. Screen Shot 2023-09-05 at 12.51.28 AM.png
 
AAPL. Similar pattern but it has come back above the DMA line. This one I would wait on for confirmation in either direction when the traders come back to work tomorrow. Screen Shot 2023-09-05 at 12.57.00 AM.png
 
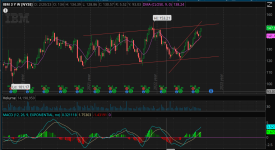
IBM. Long term is trading within a very wide range channel. Shorter term as in the last few months it is trading sharply up. However it is now getting close to the top of the wide ranging channel. Maybe it makes a run to the old high to form a double top before heading lower? My crystal ball doesn't say :)Screen Shot 2023-09-05 at 1.04.54 AM.png
 
As you can see I like the weekly charts because it gives a big picture view. All of these have had a nice run up since the beginning of the year. A pullback would be healthy or a sideways consolidation. GOOG and AMZN still look healthy but could head south if there is a severe downturn in the market.

Thats all I got. LOL. Traders will probably come back in tomorrow and destroy all my analysis. :)
 
View attachment 10277Looks to me like gold is in a slightly downtrending channel but at the same time you could argue sideways consolidation or even a cup and handle forming.I like the cup and handle but that handle could stretch out for another 6-12 months and still be valid.

Been hearing about the cup and handle since I had a full head of hair.
 
It's insurance.

Look out the window. Inflation is insane. What do you suppose will happen in a year of this?

Folks are just getting by. Look at how much debt is on credit cards. That's how they are surviving!

Too much month left at the end of the money.

Imagine taking a silver eagle you bought for $6 and cashing it in because you need dollars vs using your credit card.

You're still safe. Everyone else is at risk!
Insurance? Look around. Your house is on fire yet Silver still sits under $25 an ounce.
 
So they tell ya no one forced you to get the jab. That's like getting held up on the street the guy asks for your money or he'll shoot. You refuse. Bang your dead. Well he didn't actually force you did he? Except no job and you can't go out in many instances.
 
...
Analysts at BMO point out the S&P 500 earnings yield — that’s earnings-to-price, rather than price-to-earnings — is now barely above the yield on the 10-year Treasury BX:TMUBMUSD10Y. “Declining earnings yields compared to rising Treasury rates and the risk implied by the full faith and credit of the U.S. (even after the downgrade), begs the question of how long this dynamic can persist before returning to more historically typical levels either via higher earnings yields or lower 10-year yields,” they say.

im-846726


The initial price action on Tuesday is pointing toward the former — if stocks fall, the earnings yield rises — but for the call of the day, we’ll head to the team at UBS, who say they are bullish on bonds. (The BMO team is as well; they’re targeting the mid-August low in the 10-year of 3.95%.)

“Recent volatility in U.S. rates has raised the question of whether we are on the verge of a bear market for bonds. We do not share this view and think nominal yields will fall over our six- to 12-month forecast horizon for a number of reason,” say the UBS team led by Mark Haefele, global wealth management chief investment officer.
...

More:


whynotboth.gif

Re: Article title:

 
So they tell ya no one forced you to get the jab. That's like getting held up on the street the guy asks for your money or he'll shoot. You refuse. Bang your dead. Well he didn't actually force you did he? Except no job and you can't go out in many instances.

Didn't the mafia used to sell business protection insurance?
 
All the bond charts are like this... IDK if it's a data feed issue or a market issue for now.

US10Y_2023-09-06_08-48-29.png
 
Update on yesterday's charts... sitting on or near levels we might start to see buying. Dip below tomorrow, hopefully that is bought into.

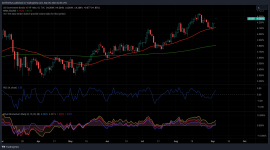
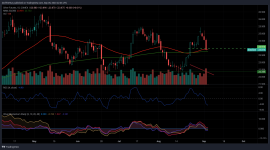
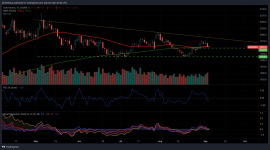
SI1!_2023-09-06_08-46-55.pngGC1!_2023-09-06_08-46-35.pngGDX_2023-09-06_08-46-09.png
 
While the rankings of the strongest currencies in the world can change over time due to economic fluctuations, as of my last knowledge update in September 2021, here is a list of the top 10 strongest currencies in the world:
  1. Kuwaiti Dinar (KWD)
  2. Bahraini Dinar (BHD)
  3. Omani Rial (OMR)
  4. Jordanian Dinar (JOD)
  5. British Pound Sterling (GBP)
  6. Cayman Islands Dollar (KYD)
  7. Swiss Franc (CHF)
  8. Euro (EUR)
  9. US Dollar (USD)
  10. Canadian Dollar (CAD)
Please keep in mind that these rankings are subject to change, and the strength of currencies can fluctuate based on various economic factors. It's essential to check the most recent exchange rates and economic conditions for the most up-to-date information on currency strength.

Gold Monthly in the strongest currency in the world...

GC1!_USDKWD_2023-09-06_10-06-10.png
 
DXY on the weekly has 8 green bars in a row. My chart settings go back 3 years and never seen that in 3 years. Dolla seems due for cooling off period.
 
Back
Top Bottom